Ocean Plastic Leakage Estimator
Use this calculator to understand how different factors contribute to ocean plastic leakage. Adjust the sliders or select a preset country to see how Per Capita Generation, Collection Rate, and Leakage Factor combine to determine total ocean impact.
Estimated Annual Ocean Leakage
0
Metric Tons per Year
Adjust parameters to see analysis.
You might think the answer is obvious. Maybe it’s the country with the most beaches? Or the one with the biggest fishing fleet? Nope. When we talk about who puts the most plastic into the ocean, the data points to a surprising culprit: China. But wait-before you point fingers, there is a massive twist in this story that changes everything about how we view global marine pollution.
Here is the reality check. For years, reports stated that China dumped more plastic into the sea than any other nation. The numbers were staggering. However, those old stats missed a crucial detail: they counted the waste generated within China's borders but ignored where that waste actually ended up. Why? Because for decades, wealthy nations shipped their trash to China to be recycled or landfilled. So, while China physically handled the bulk of the world's plastic garbage, the responsibility was shared globally.
The Shift After 2018: Who Is Responsible Now?
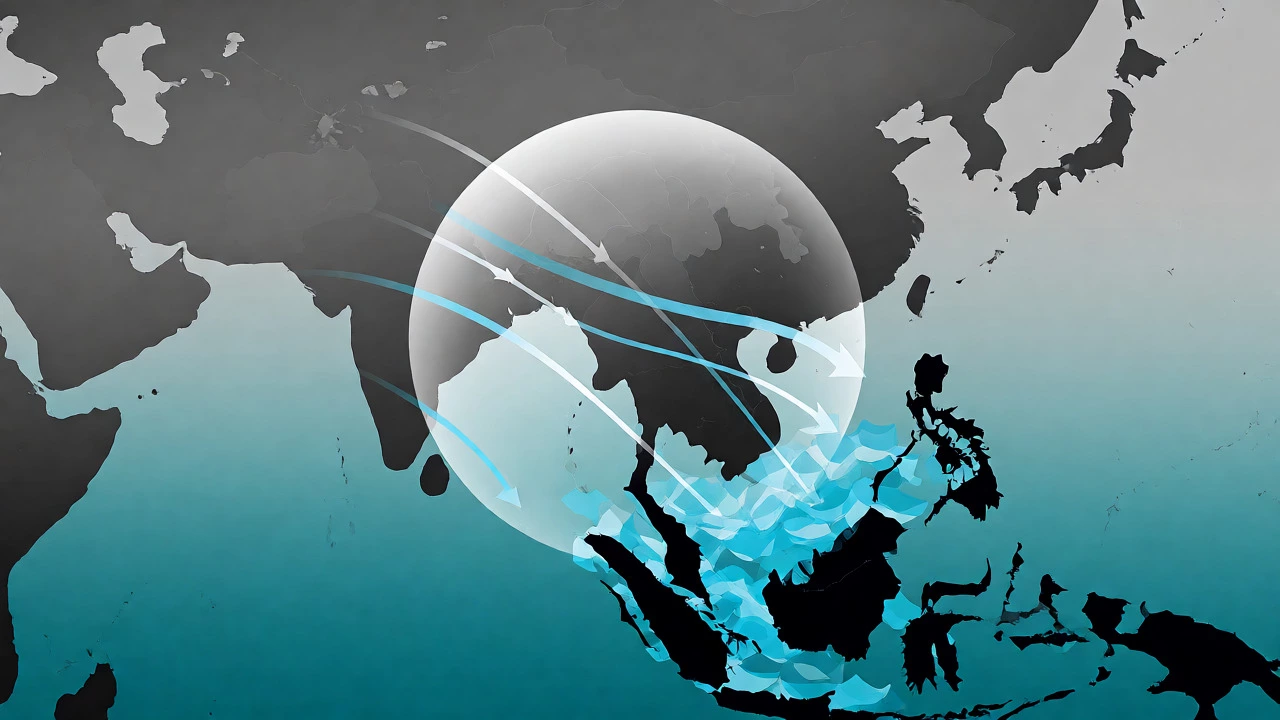
In January 2018, China implemented the "National Sword" policy, banning the import of most foreign plastic waste. This single move reshuffled the entire deck. Suddenly, countries like the United States, Germany, and Japan had nowhere to send their recyclables. They either started hoarding it, burning it, or shipping it to Southeast Asia. So, if we look at current data from 2026, who is the actual polluter?
If we measure by the volume of mismanaged plastic waste entering the ocean today, the list shifts slightly. While China still produces the highest volume of plastic globally, its domestic management systems have improved drastically. Today, countries with poor waste infrastructure and high consumption rates are often the real offenders. Let’s break down the top contributors based on recent environmental audits.
Top Contributors to Ocean Plastic Pollution
It is not just about production; it is about leakage. A country can produce tons of plastic, but if it captures and recycles it, the ocean stays clean. If it leaks, the ocean suffers. Here are the key players in this messy game.
| Country | Primary Cause | Estimated Leakage | Waste Management Status |
|---|---|---|---|
| Indonesia | Lack of collection infrastructure | ~3.2 Million | Poor rural coverage |
| Philippines | High consumption + low recycling | ~2.5 Million | Fragmented system |
| Vietnam | Rapid industrialization | ~1.8 Million | Improving but lagging |
| India | Population density + open dumping | ~1.5 Million | Varies by region |
| Brazil | Coastal tourism + river runoff | ~1.2 Million | Moderate urban, poor rural |
Notice something? China isn't even on this specific leakage list anymore. That is because their investment in waste-to-energy plants and strict sorting laws has reduced the amount of trash escaping into rivers like the Yangtze and Yellow River. Instead, the burden has shifted to nations in Southeast Asia and South America, where rapid economic growth outpaced the development of sanitation infrastructure.
Why Rivers Are the Real Highway to the Sea
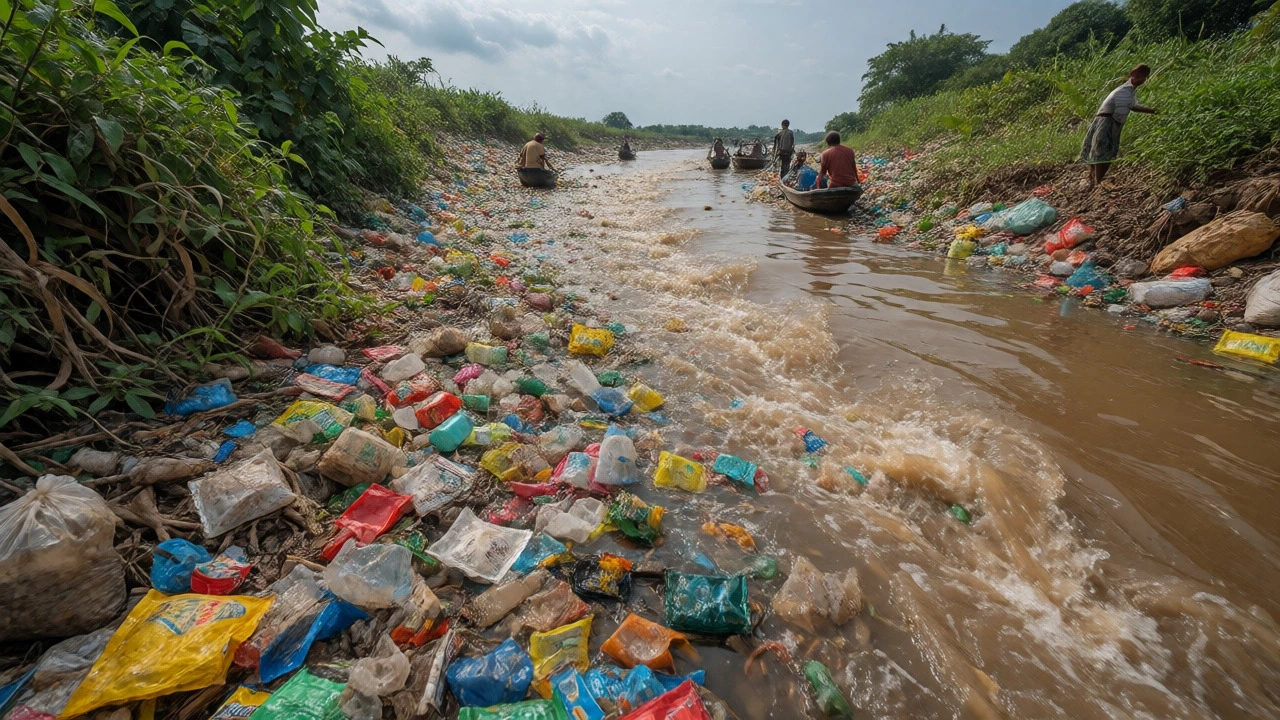
You might imagine plastic floating away from a beach. In reality, over 80% of ocean plastic comes from land-based sources, specifically rivers. Think of rivers as conveyor belts. If a village near a riverbank dumps a bag of wrappers, that plastic doesn't stay put. It travels hundreds of miles until it hits the coast.
For instance, the Ganges River in India carries massive amounts of debris into the Bay of Bengal. Similarly, the Mekong River, which flows through multiple Southeast Asian countries, acts as a major conduit for waste from Laos, Thailand, Cambodia, and Vietnam. This means that blaming a single country is tricky. A piece of plastic thrown in northern Vietnam might end up on a beach in the Philippines. It’s a transboundary problem.
The Role of Plastic Manufacturers
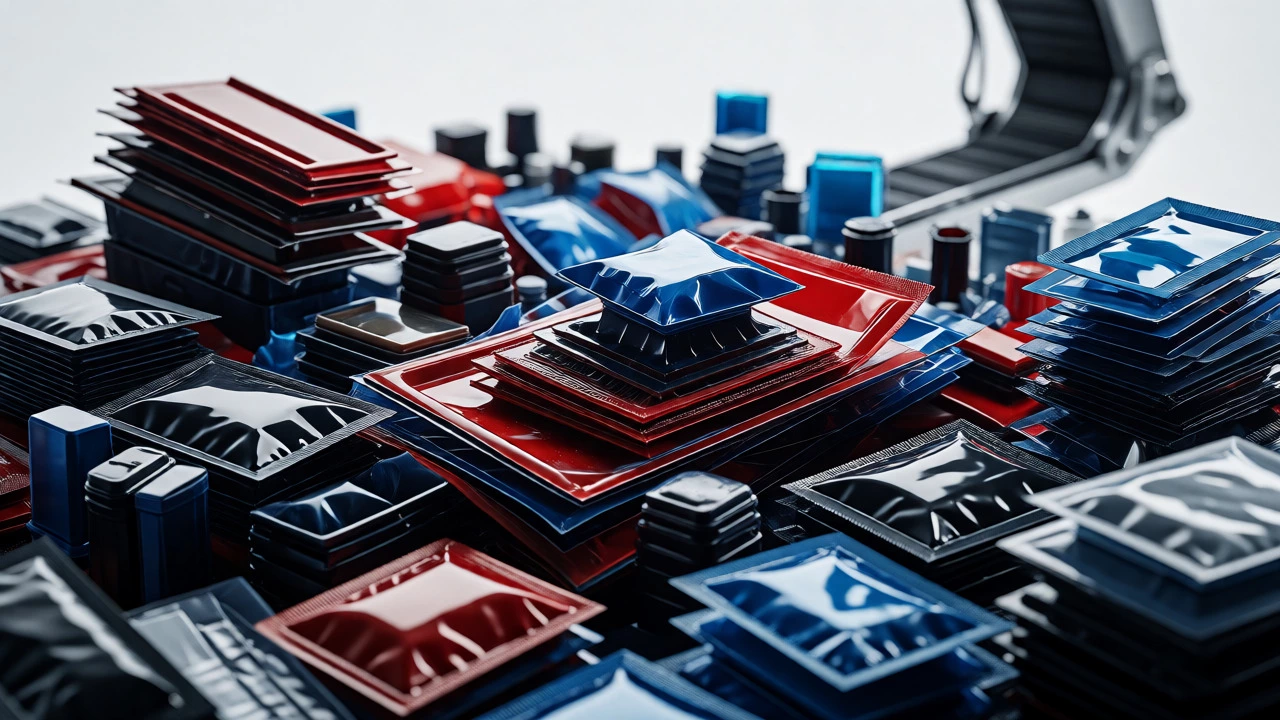
This brings us back to the industry itself. Who makes all this stuff? Global giants like Dow Inc., SABIC, and ExxonMobil produce millions of tons of virgin resin every year. These companies don't dump the plastic themselves, but they design products that are hard to recycle. Single-use sachets, multi-layer packaging, and dark-colored plastics are nightmares for recycling facilities.
A study published in 2025 highlighted that just twenty manufacturers are responsible for half of all plastic pollution. The argument here is simple: if manufacturers designed better packaging, fewer countries would struggle to manage it. We see this happening now with brands switching to mono-materials. But the pace is slow. Until the source of the leak-the product design-is fixed, no amount of cleanup crews will solve the crisis.
What About the High Seas?
Some people argue that fishing nets are the main issue. And they are right about one thing: ghost gear accounts for a significant portion of large debris. Countries with large industrial fishing fleets, such as Spain, Japan, and South Korea, contribute heavily to this type of pollution. Unlike bottles and bags, these nets take centuries to degrade. They trap fish, turtles, and whales long after the boats have returned to port.
However, when we weigh microplastics and consumer waste against fishing gear, consumer waste wins by volume. Fishing gear is heavier, but there are simply billions more plastic bottles, straws, and food containers entering the water annually.
How Can You Tell Who Is Really Guilty?
Don't rely on headlines alone. Look at three metrics:
- Per Capita Generation: How much plastic does each person use? Americans generate far more per person than Indians, but India has four times the population.
- Collection Rate: What percentage of waste is actually collected before it hits the street?
- Leakage Factor: How much of the uncollected waste ends up in waterways?
When you combine these, you get a clearer picture. The United States generates massive amounts of waste but has decent collection systems. Consequently, its leakage rate is lower than expected given its consumption. Conversely, smaller island nations may generate less total waste but lack the infrastructure to contain it, leading to disproportionately high local pollution levels.
The Future Outlook for 2026 and Beyond
We are seeing a shift. The EU's ban on certain single-use plastics has forced manufacturers to innovate. Meanwhile, new treaties are being negotiated to cap plastic production globally. The goal is to reduce virgin plastic production by 40% by 2040. If successful, this could drastically change the leaderboard of polluters.
But technology alone won't fix it. We need financial support for developing nations to build waste management plants. Without money, infrastructure projects stall. And without infrastructure, plastic keeps flowing into the sea, regardless of who made it.
Which country produces the most plastic overall?
China remains the largest producer of plastic goods globally, accounting for roughly 30% of global production. However, production does not equal pollution. Due to improved waste management policies post-2018, China's contribution to ocean leakage has decreased significantly compared to previous decades.
Does the USA contribute to ocean plastic?
Yes, the USA is one of the highest generators of plastic waste per capita. While it exports less waste now than before 2018, it still struggles with recycling rates below 10%. Much of its waste ends up in landfills or incinerators, but leakage via coastal cities and rivers still contributes notably to Pacific pollution.
Why do rivers matter so much for ocean pollution?
Rivers act as transport mechanisms. Studies show that ten major rivers carry up to 90% of river-borne plastic to the ocean. If waste is not captured upstream, gravity and currents ensure it reaches the sea. Therefore, managing inland waste is critical to protecting marine environments.
Are fishing nets worse than plastic bottles?
In terms of weight and immediate danger to wildlife, abandoned fishing nets (ghost gear) are extremely harmful. However, in terms of total volume and microplastic contamination, consumer plastics like bottles, bags, and packaging make up the majority of ocean debris.
Can recycling solve the ocean plastic problem?
Recycling helps, but it is not a silver bullet. Currently, only a small fraction of plastic is successfully recycled. Many types degrade in quality after one cycle. To truly stop ocean pollution, we must reduce production at the source and improve waste capture infrastructure in high-leakage regions.